What the BIS survey says about the size of the forex market
"The forex market trades several trillion dollars a day" is repeated everywhere, and it usually traces back to one source: the Triennial Central Bank Survey of the Bank for International Settlements (BIS). Central banks collect turnover from major dealers every three years, in April, and the BIS publishes the results in the autumn. Reading the tables tells you more than the headline does.
The headline
The 2022 survey reported average daily turnover of about 7.5 trillion US dollars, up from about 6.6 trillion in 2019. The 2025 survey was published in September 2025 and reported a further increase to a figure in the region of 9.6 trillion dollars; check the BIS website for the exact numbers before you quote them. Note that this counts dealer-reported turnover, adjusted for double counting between dealers, so it is a measure of activity and not of the money that ends up in anyone's pocket.
Spot is not most of it
The surprise for many readers is the breakdown by instrument. In the 2022 data, FX swaps made up the largest part, roughly half of turnover, followed by spot at roughly 28%, outright forwards at roughly 15%, and small shares for currency swaps and options. FX swaps are mostly funding and hedging transactions between banks and institutions: one currency is exchanged now and reversed at a set later date. That is a different business from a retail account clicking buy on EUR/USD. Retail trading is a small fraction of the total, and the BIS survey does not attempt to isolate it.
The dollar is nearly everywhere
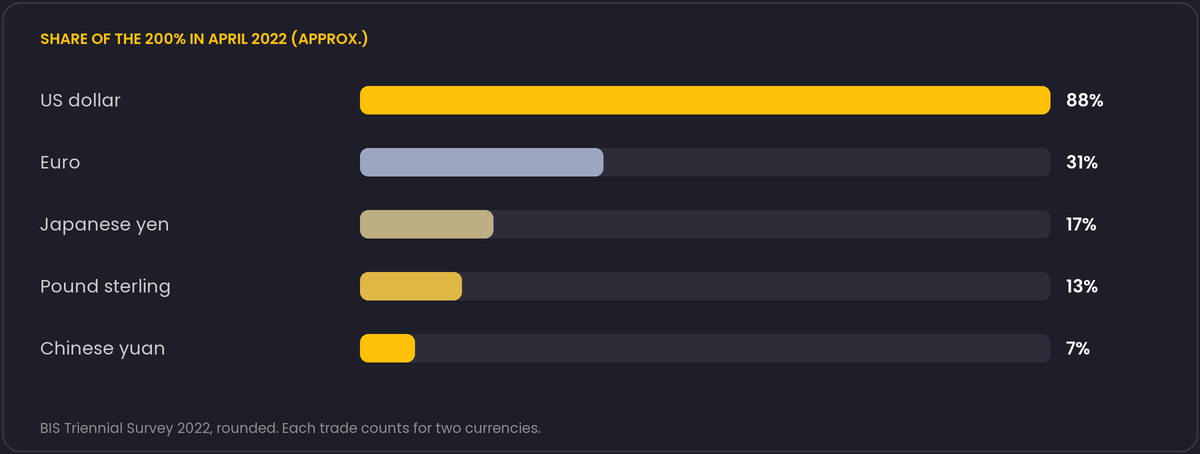
Because every trade has two currencies, shares of currencies add up to 200%. The dollar was on one side of about 88% of trades in 2022. The euro followed at about 31%, the yen at about 17% and the pound at about 13%. This is the reason the dollar pairs are the deepest markets, and the reason crosses like EUR/GBP are often priced through USD legs (see the post on cross rates).
Where trading happens
The survey also reports turnover by the location of the sales desk. In 2022 the United Kingdom was the largest centre with well over a third of the total, followed by the United States, Singapore, Hong Kong and Japan. The order has been stable for a long time, which is why London hours dominate any chart of activity by hour.
Using these numbers responsibly
- Give the year and the source. "7.5 trillion a day" is a 2022 figure for April of that year.
- Do not present it as retail volume or as the amount you can trade. Depth at your broker is a different, much smaller thing.
- The figures are rounded in most summaries, and the survey is revised between editions when methodology changes. If a number matters for a decision, download the tables from the BIS instead of copying it from an article.
The survey is also a useful reminder for anyone building products around forex: the market's size does not translate into a single price or a shared volume feed, which is the subject of the last post in this series.
"Net-net" and why the same trade is not counted twice
The BIS figures are described as "net-net" turnover, a specific adjustment worth understanding before comparing them to any other volume number you encounter. Raw reporting from dealers would double-count a trade between two reporting banks, since both sides of the deal report it independently; "net" removes that double counting locally within each country's reporting, and the second "net" removes double counting globally between reporting countries when the trade crosses a border. The result is closer to an economically meaningful measure of total activity than a simple sum of what every desk reported, but it also means the figure cannot be reconstructed by adding up individual banks' own published volumes, which are typically gross, and a comparison between a bank's self-reported turnover and its rough share of the BIS total should account for that difference in methodology before concluding one of the two numbers is wrong.