Cross rates: how EUR/GBP is built from two dollar pairs
The dollar sits on one side of most currency trades, so liquidity in the market is organised around USD pairs. A cross rate is any pair that does not contain the dollar, and the price of one can always be derived from two others.
The derivation
EUR/USD tells you how many dollars one euro costs, and GBP/USD does the same for a pound. To get euros per pound you divide the two. With EUR/USD at 1.0800 and GBP/USD at 1.2700:
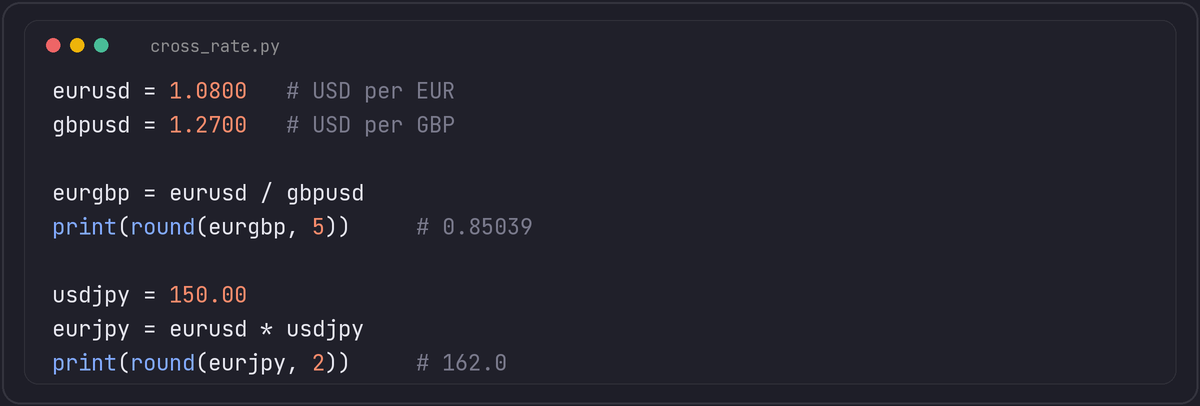
EUR/GBP is 1.0800 ÷ 1.2700 = 0.85039. The direction of the division depends on how each pair is quoted, so check which currency is the base each time. The same rule handles yen crosses: EUR/JPY is EUR/USD multiplied by USD/JPY, because the dollar in the middle cancels out.
Directly traded or synthetic
Many crosses have their own liquid market, and EUR/GBP, EUR/JPY and GBP/JPY are traded directly between dealers. Less traded crosses are often priced synthetically from the two legs. The consequence is that a synthetic cross has a wider spread than either leg, since you pay both. The relationship also acts as a check, because a direct cross and the price implied by its legs should agree within costs. If they do not, an arbitrageur removes the difference quickly, and on a data feed a persistent gap suggests stale quotes or a bad timestamp on one leg.
Implications for data and code
- Two legs sampled at different moments give a cross that never existed. When you derive a cross from ticks, take both legs at the same timestamp, or use the most recent tick of each with a stated tolerance.
- Derive bid and ask, not just mid prices. The synthetic ask of EUR/GBP uses the ask of one leg and the bid of the other, because buying EUR/GBP means selling pounds for dollars and then buying euros with those dollars, and a mid-only calculation hides the doubled spread.
- Correlation between crosses and their legs is mechanical. If you study several pairs at once, you are looking at overlapping exposures to the same few currencies, not independent markets, so counting them as separate observations exaggerates the evidence.
A small consistency test is a good habit for any pipeline that stores several pairs: compute the cross from the legs at every timestamp and compare with the directly stored cross. Differences beyond the typical spread point at timestamp alignment or symbol mapping mistakes, and finding them takes minutes with a test and hours in production.
Measuring the gap directly
The consistency check described above is worth seeing in numbers rather than only as a general principle. With EUR/USD at 1.0800 and GBP/USD at 1.2700, the implied EUR/GBP from dividing the two legs is 0.85039, worked out earlier. If a directly quoted EUR/GBP shows 0.85050 at the same moment, the gap is (0.85050 − 0.85039) × 10,000 ≈ 1.1 pips. Whether that is normal or a data problem depends entirely on what the combined spread of the two legs and the direct quote would be expected to allow: for major pairs with spreads of a fraction of a pip each, a gap of a full pip sustained across many consecutive timestamps, rather than appearing and disappearing tick to tick, points at a timestamp alignment problem or a stale leg rather than a real, persistent arbitrage, since real triangular arbitrage between liquid major pairs is closed by market participants in a small fraction of a second. A monitoring job that computes this gap continuously and alerts when it exceeds a threshold for more than a few consecutive samples is a cheap, effective way to catch a broken data feed before it corrupts anything built on top of it.