Do daily candle streaks continue in metals and oil?
- Markets
- Period
- –
- Period length
- 2005 – 2026
- Data
- 1-hour candles built from one-minute data
- Sample
- 32,823 market-days from 7 markets (about 4,690.0 trading days each)
- Source
- OANDA CFD one-minute mid prices · New York trading days
"Three green days in a row, the trend is strong." Or: "three green days, a pullback is due." Both ideas are common, and they cannot both be right. We counted what the next daily candle did after every streak in 7 markets from 2005 to September 30, 2026: Gold (XAU/USD), Silver (XAG/USD), Palladium (XPD/USD), Platinum (XPT/USD), Copper (XCU/USD), WTI crude oil and Brent crude oil.
The daily candle used here
The usual forex convention ends the trading day at 17:00 New York time, and every market on this page is cut the same way: a day runs from 17:00 to 17:00 New York time, Monday to Friday. The open is the open of the day's first 1-hour candle, the close is the close of its last one, and the high and the low are the highest and lowest prices of the whole day. Charts that cut the day at midnight UTC draw different daily candles, so their counts will differ.
Candle streaks: Commodities together
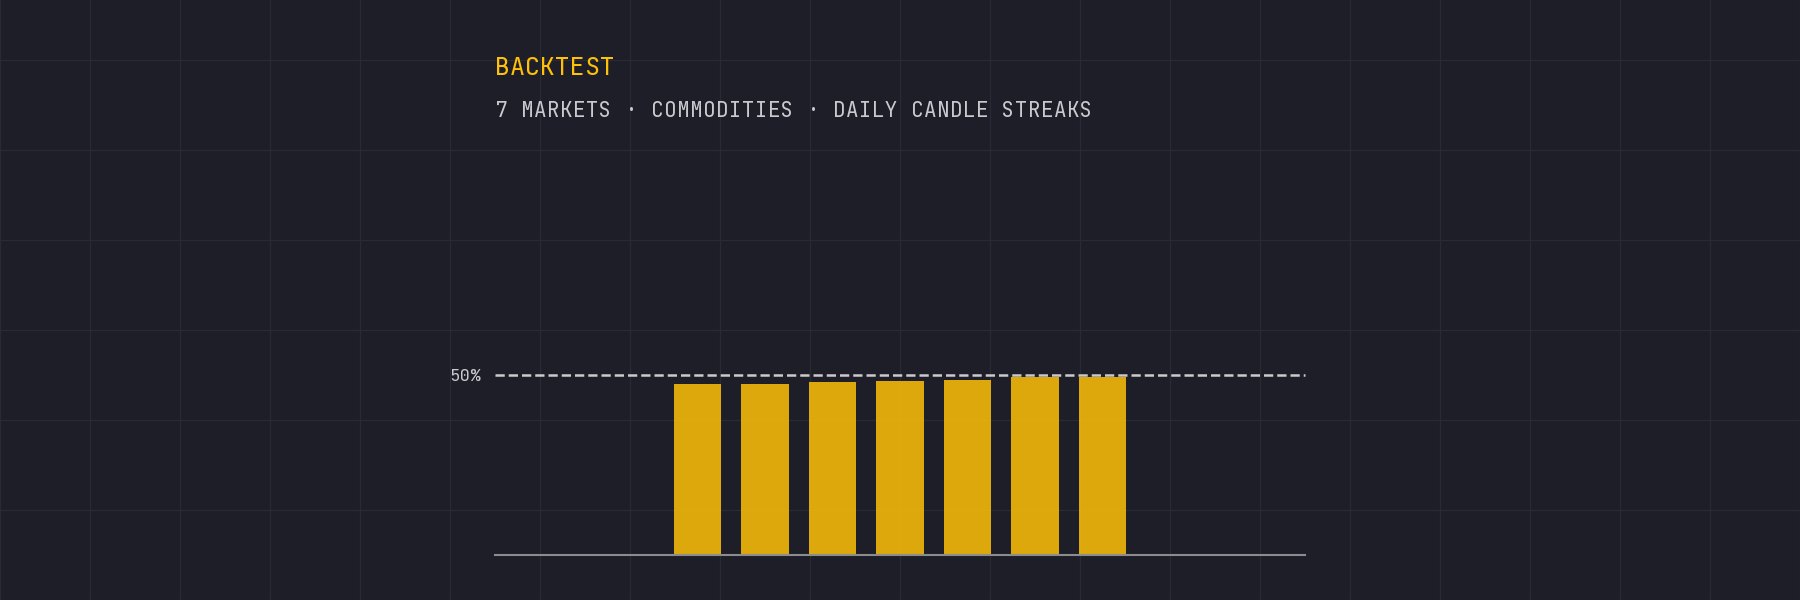
How often the next daily candle had the same colour as the streak before it:
- After one day: 48.3% of next days had the same colour (16,955 cases).
- After 2 days in a row: 48.2% of next days had the same colour (8,185 cases).
- After 3 days in a row: 47.5% of next days had the same colour (3,939 cases).
- After 4 days in a row: 49.2% of next days had the same colour (1,869 cases).
- After 5 or more days in a row: 49.0% of next days had the same colour (1,803 cases).
Every streak length lands within four points of 50%: the colour of the next daily candle is close to a coin flip, however long the streak. If anything, the next day leans slightly the other way.
Year by year
After a single up or down day, the group's share of same-colour next days ranged from 44.0% (2025) to 53.9% (2023) over the 13 full years in which all 7 markets traded. The results section below shows every market by year. The longer the streak, the fewer the cases, so the yearly numbers for long streaks swing more.
Why publish this?
Rules built on counting candles of the same colour are everywhere, and this is what they look like when counted on years of data. Any idea built on streaks has to beat these numbers, after costs, before it is worth anything.
Results by market
All years together, one row per market; the last row adds the markets together. Every value is a percentage of the days counted. Pick a market's name to see it year by year.
Commodities
7 markets
| Market | Days | Same colour next day | ||||
|---|---|---|---|---|---|---|
| After 1 day | After 2 | After 3 | After 4 | After 5+ | ||
| Gold (XAU/USD) | 5100 | 47.4 | 46.4 | 45.2 | 47.6 | 48.0 |
| Silver (XAG/USD) | 5096 | 47.5 | 46.1 | 45.4 | 48.3 | 48.4 |
| Palladium (XPD/USD) | 3746 | 49.5 | 48.3 | 48.6 | 50.0 | 57.4 |
| Platinum (XPT/USD) | 4257 | 49.5 | 49.9 | 49.2 | 51.0 | 50.8 |
| Copper (XCU/USD) | 3545 | 48.5 | 47.5 | 48.9 | 45.2 | 46.0 |
| WTI crude oil | 5580 | 48.0 | 50.4 | 46.3 | 52.5 | 46.3 |
| Brent crude oil | 5499 | 48.5 | 48.5 | 49.5 | 48.8 | 45.9 |
| All commodities | 32823 | 48.3 | 48.2 | 47.5 | 49.2 | 49.0 |
Year by year
Copper (XCU/USD): 3545 complete trading days, 2013-01-02 to 2026-09-30.
| Year | Days | Same colour next day | ||||
|---|---|---|---|---|---|---|
| After 1 day | After 2 | After 3 | After 4 | After 5+ | ||
| 2013 | 258 | 41.1 | 45.0 | 33.3 | 66.7 | 60.0 |
| 2014 | 258 | 43.4 | 40.3 | 60.0 | 46.7 | 46.2 |
| 2015 | 258 | 51.5 | 39.7 | 55.6 | 46.7 | 56.2 |
| 2016 | 258 | 47.3 | 45.9 | 78.6 | 54.5 | 33.3 |
| 2017 | 257 | 49.6 | 55.0 | 57.6 | 42.1 | 66.7 |
| 2018 | 258 | 53.4 | 48.6 | 51.5 | 23.5 | 42.9 |
| 2019 | 258 | 47.7 | 58.7 | 51.4 | 26.3 | 28.6 |
| 2020 | 259 | 50.0 | 54.7 | 45.7 | 56.2 | 43.8 |
| 2021 | 258 | 53.9 | 46.4 | 51.5 | 41.2 | 36.4 |
| 2022 | 257 | 53.9 | 53.6 | 41.7 | 40.0 | 33.3 |
| 2023 | 257 | 54.6 | 45.7 | 42.4 | 57.1 | 20.0 |
| 2024 | 259 | 44.4 | 41.5 | 38.5 | 60.0 | 57.1 |
| 2025 | 257 | 42.3 | 56.9 | 47.1 | 43.8 | 41.7 |
| 2026* | 193 | 48.2 | 32.7 | 22.2 | 50.0 | 0.0 |
| All years | 3545 | 48.5 | 47.5 | 48.9 | 45.2 | 46.0 |
Every value is a percentage of the days counted. * 2026 runs until 2026-09-30.
How this was measured
- Data: OANDA CFD one-minute mid prices (halfway between bid and ask). They are grouped into 1-hour candles in New York time, so US daylight saving time is followed automatically, including the older rules before 2007.
- Trading day: 17:00 to 17:00 New York time, Monday to Friday. Asia 17:00–02:00, London 02:00–08:00, New York 08:00–17:00.
- Which days count: a day needs at least one traded hour in every session and at least 75% of the usual number of trading hours for that market in that year. Holidays and half days drop out this way.
- Which years count: a market's year is used only if it has at least 100 complete days. Years where a market did not trade in all three sessions are therefore left out for that market.
- Ties: when two sessions reach exactly the same price, the earlier session gets it.
- Totals: "together" simply adds up the market-days of the 7 markets. Markets in the same group move together (the crosses share currencies, the US indices move as one), so 32,823 market-days are not 32,823 independent observations.
- Year by year in the text: only full calendar years in which every one of the 7 markets has data are used, so the group is the same in every year. The current, unfinished year is not part of that range (it is in the tables, marked with *).
- Period: 2005 (or the first year with full data for a market) to September 30, 2026.
- Daily candle: open of the first 1-hour candle, close of the last one, high and low of the whole day (17:00 to 17:00 New York time).
- Streak: the number of daily candles in a row with the same colour, ending on the day before. A day that closes exactly at its open ends a streak. Streaks of five days or more are counted together.
- Next day: the next counted trading day, at most a week later; across a longer gap no streak is carried over.
Historical statistics for research and education, not trading advice. Past market behaviour does not guarantee future results.