Market statistics measured on years of price data. Every study shows its charts, how many cases were counted
and exactly how the numbers were produced, including the results that turned out to be nothing.
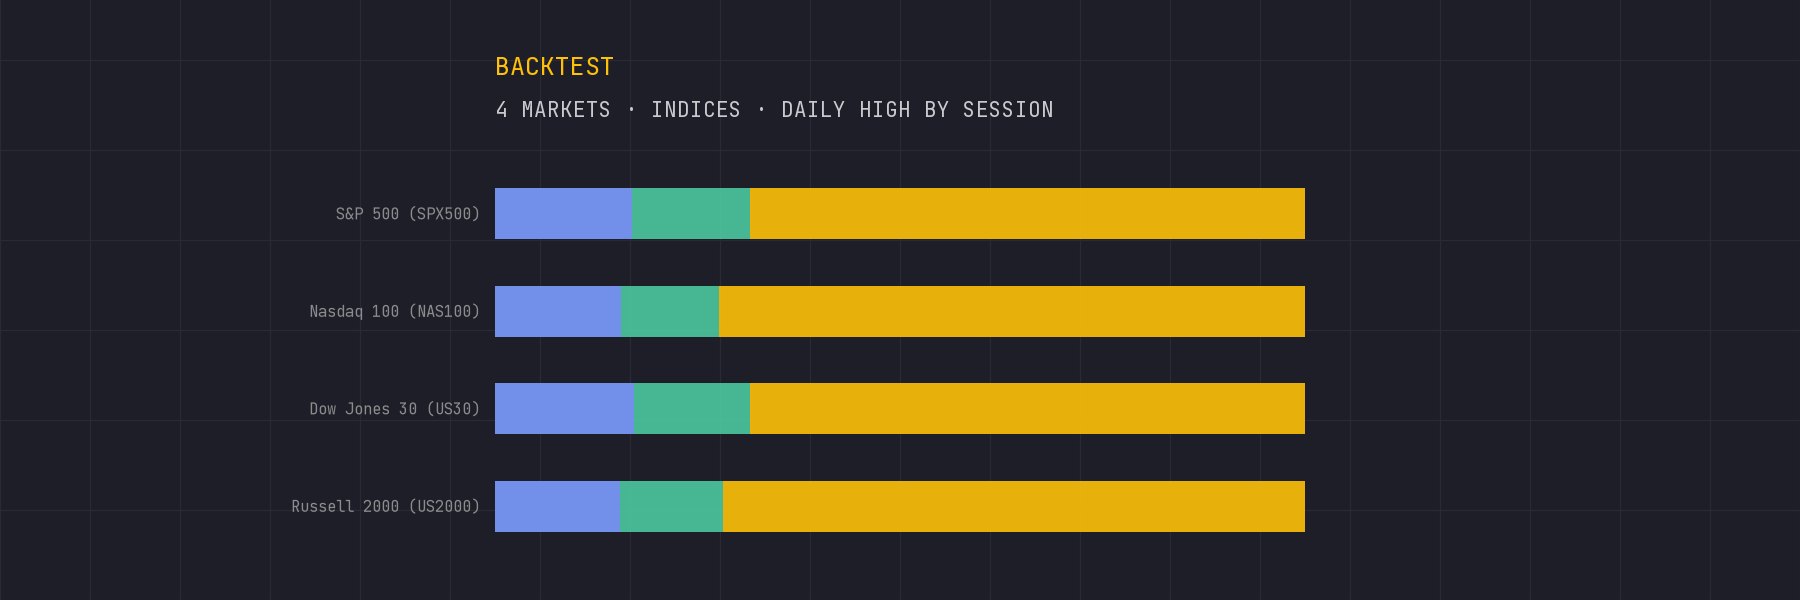
70.3%of daily highs were made in the New York session (time share: 37.5%)
We checked which session printed the high and the low of every trading day in 4 US stock indices since 2005. New York printed 70.3% of the highs, above its time share.
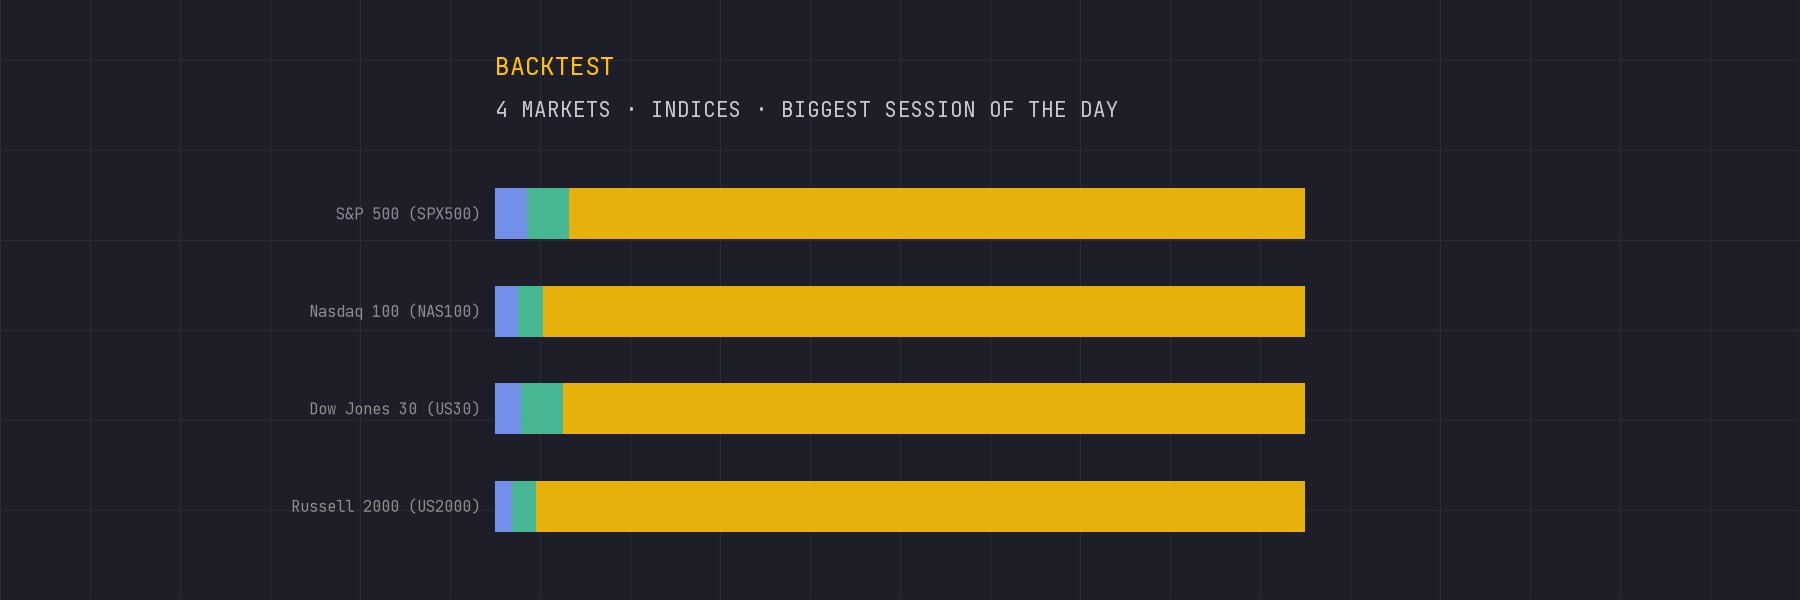
For every trading day since 2005 we measured how much of the day's range each session covered in 4 US stock indices. New York had the biggest range on 92.8% of days.
S&P 500 (SPX500)
Nasdaq 100 (NAS100)
Dow Jones 30 (US30)
Russell 2000 (US2000)
Read the backtest
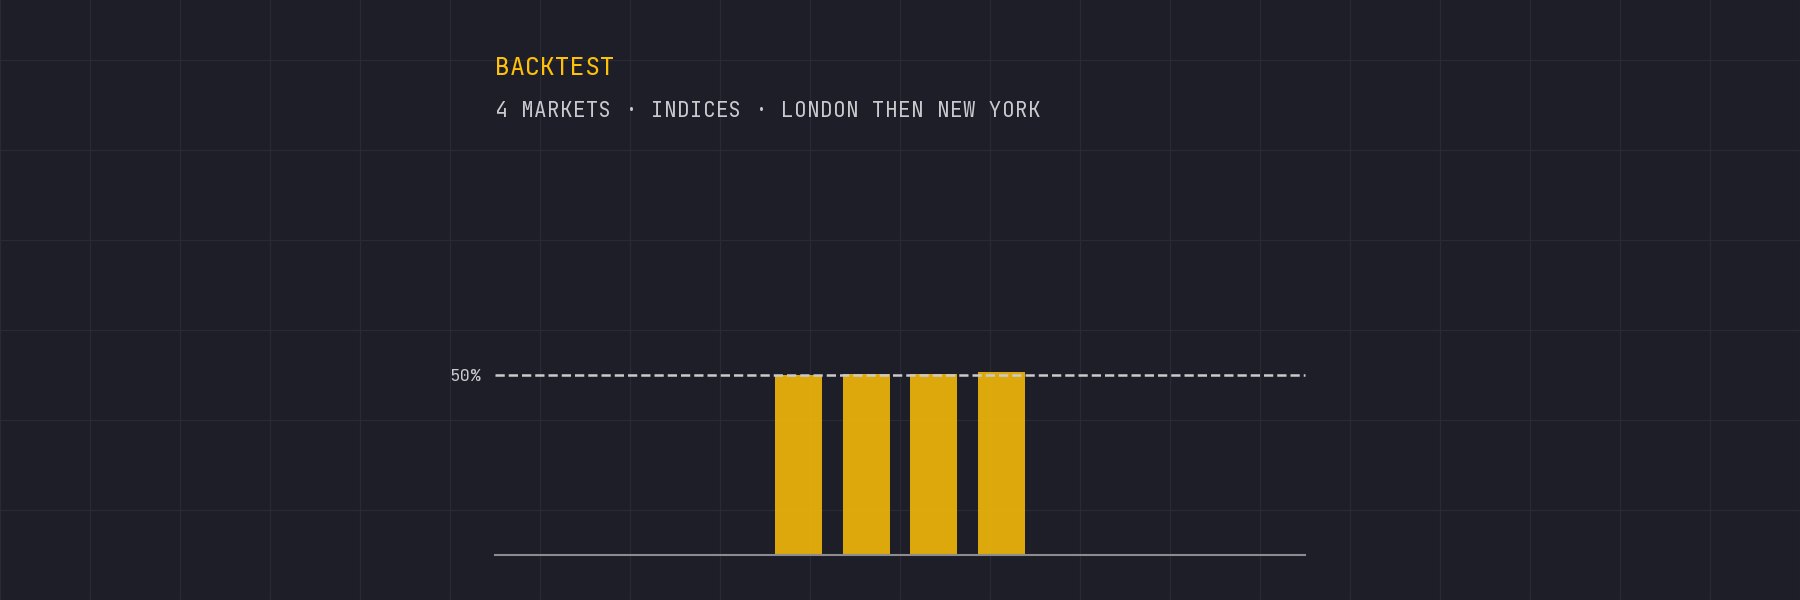
50.3%of the time New York closed in the same direction as London
If London closes up, is New York more likely to close up too? We counted 21,560 London–New York pairs in 4 US stock indices: New York closed in the same direction on 50.3% of days.
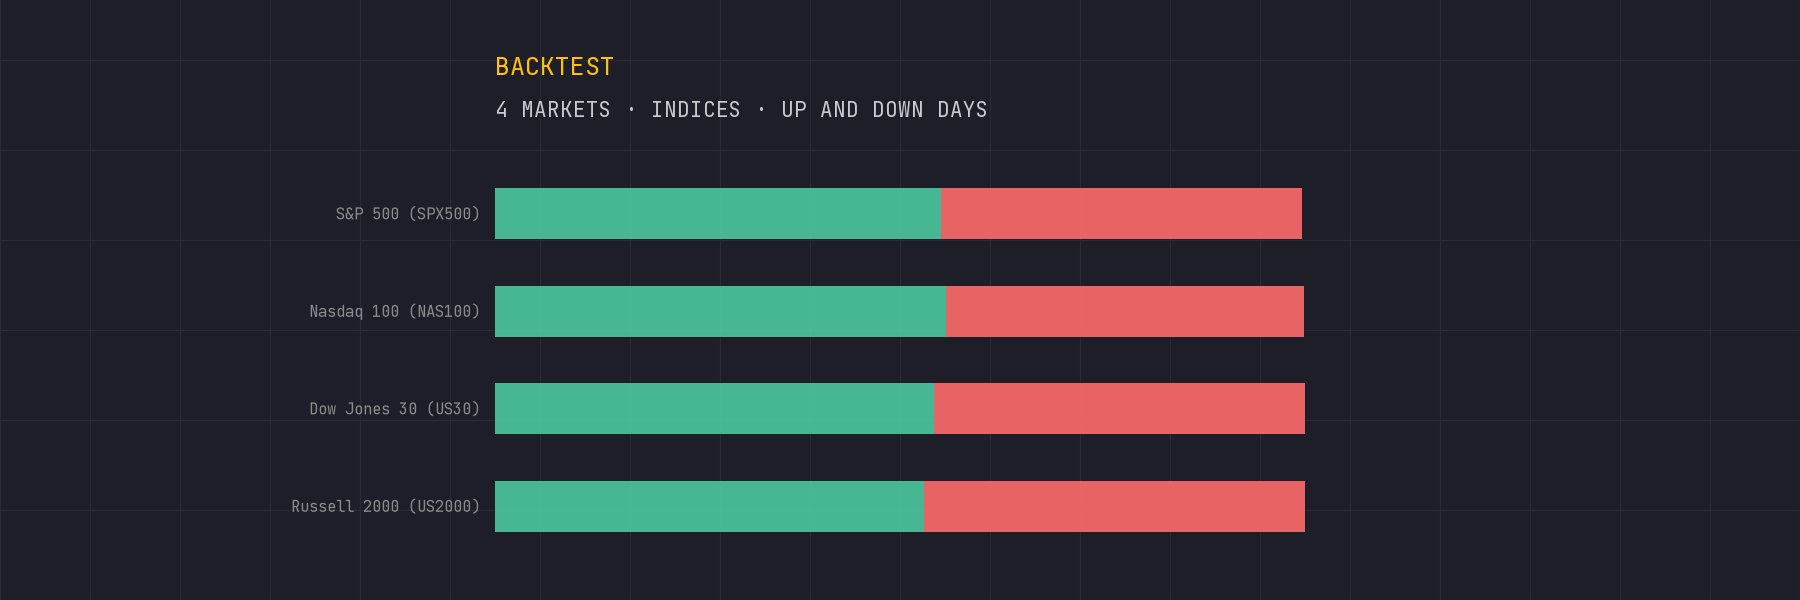
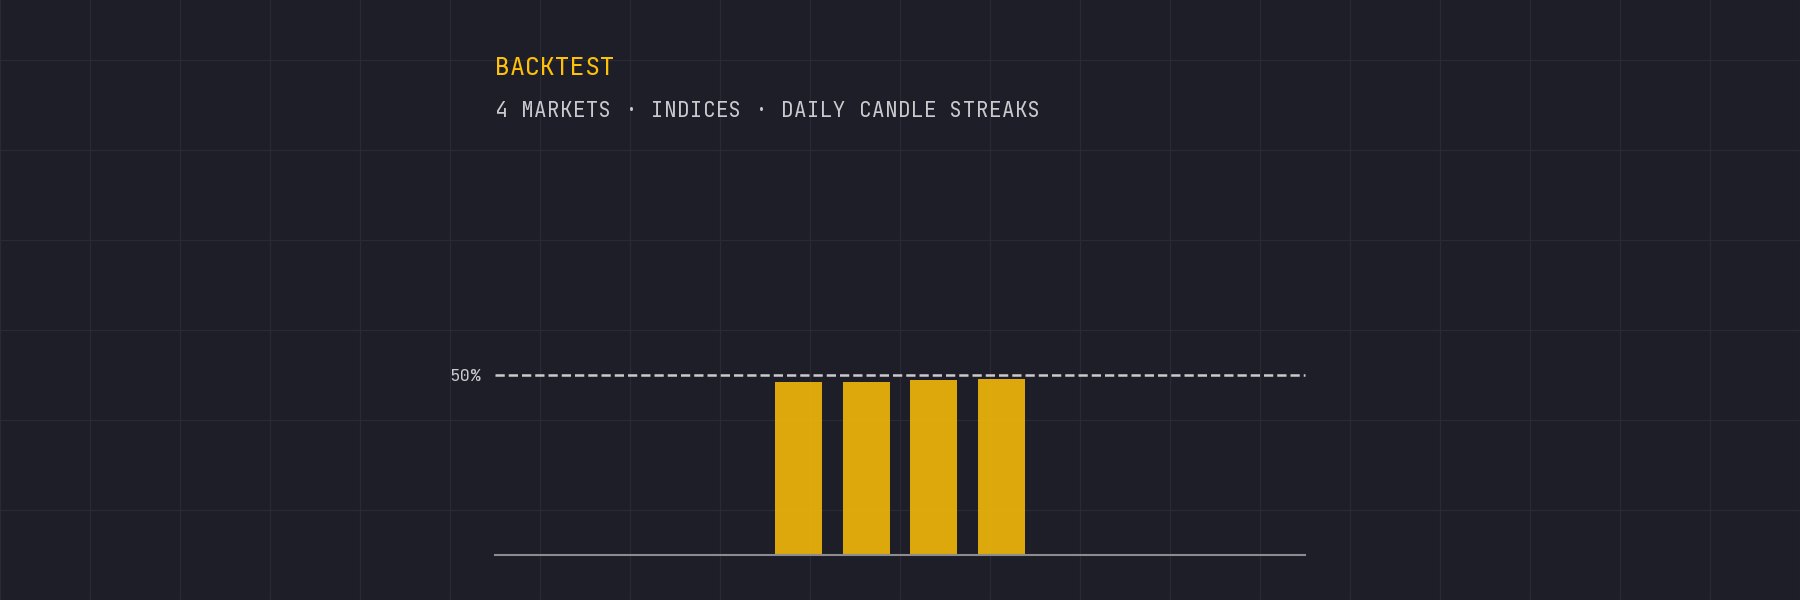
After two, three or five daily candles of the same colour in a row, is the next one more likely to match? We counted 21,717 cases in 4 US stock indices.
S&P 500 (SPX500)
Nasdaq 100 (NAS100)
Dow Jones 30 (US30)
Russell 2000 (US2000)
Read the backtest
46.4%of the day's range is candle body on an average day
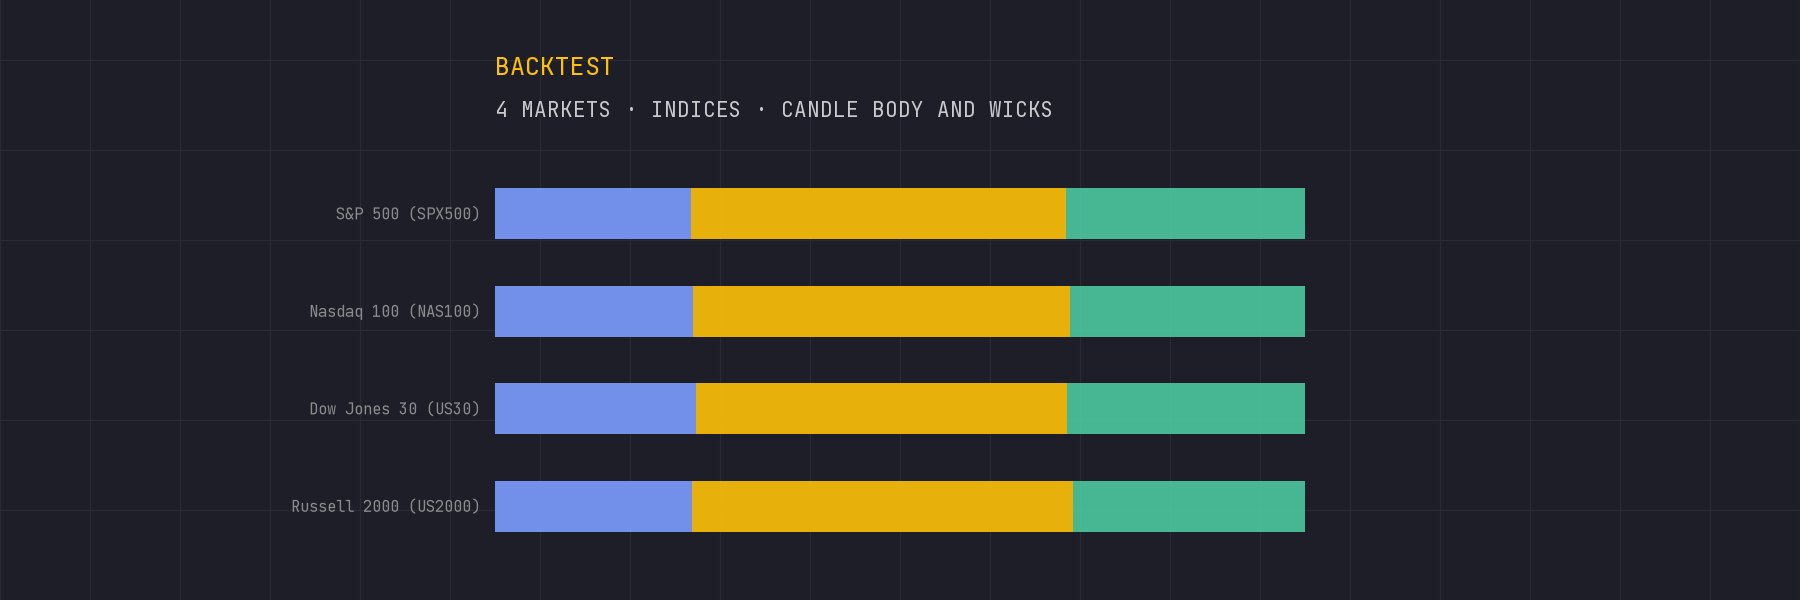
On an average day the candle body covered 46.4% of the day's range, the upper wick 24.4% and the lower wick 29.1%, in 4 US stock indices since 2005. Doji days: 10.6%.
S&P 500 (SPX500)
Nasdaq 100 (NAS100)
Dow Jones 30 (US30)
Russell 2000 (US2000)
Read the backtest
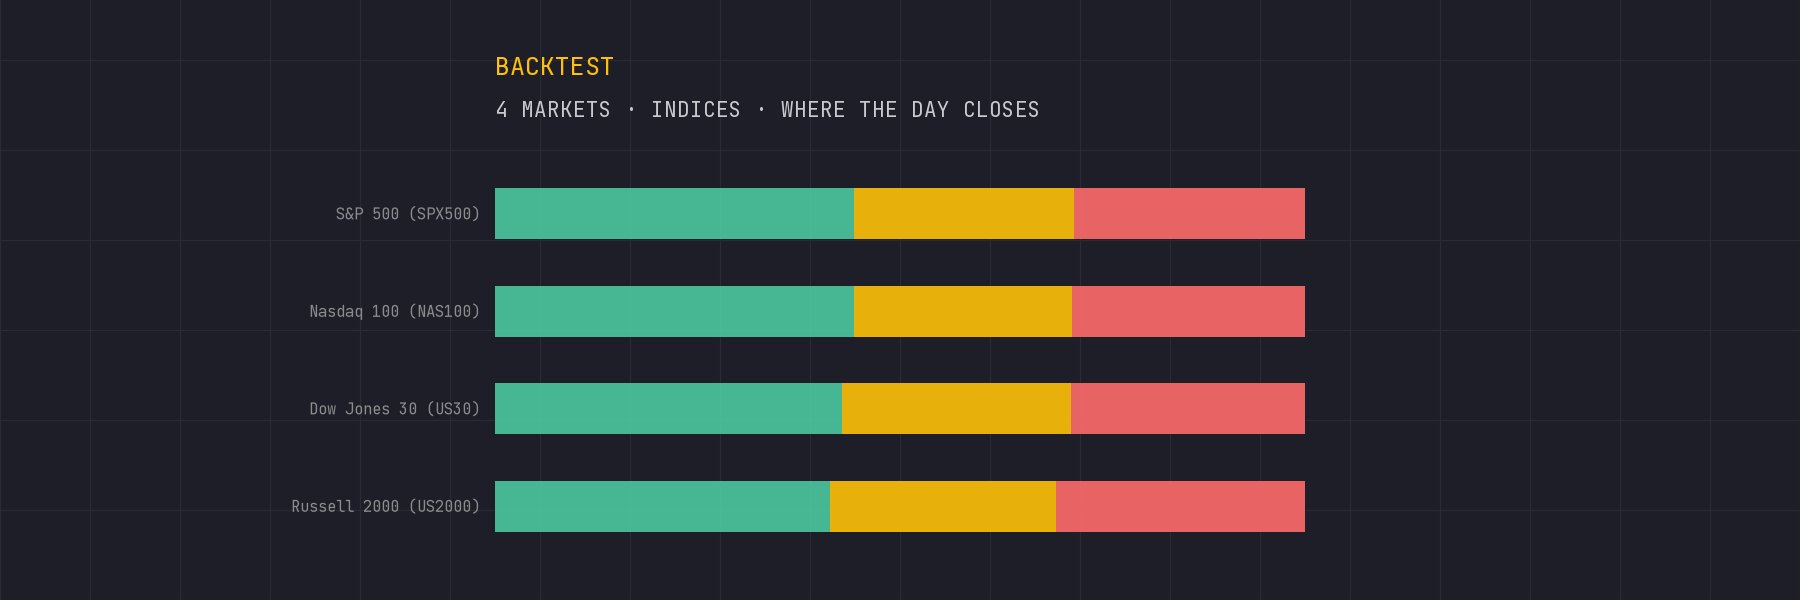
43.2%of days closed in the top third of the day's range
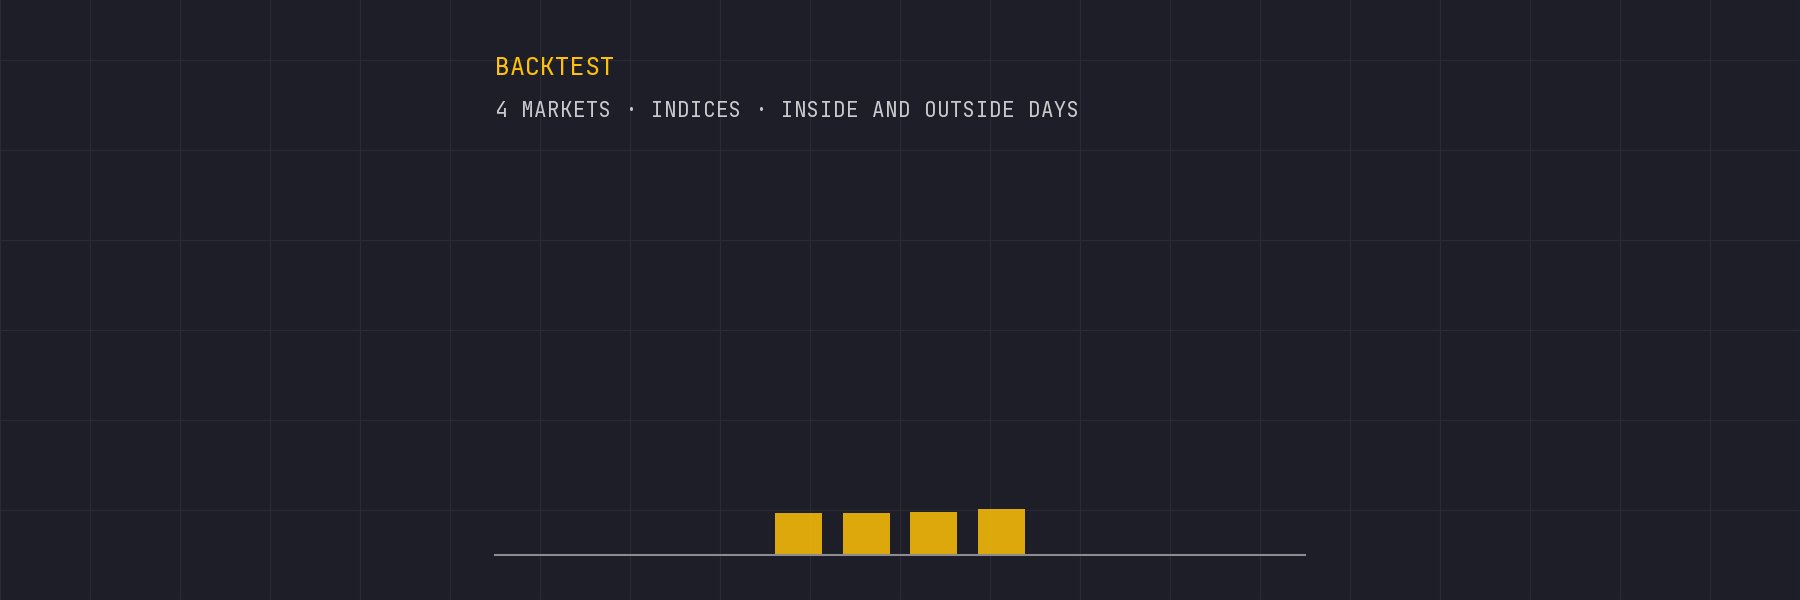
An inside day stays within the previous day's high and low; an outside day goes past both. In 4 US stock indices since 2005: inside days 12.0%, outside days 12.4%.