How much of the day's range does each session cover in the major currency pairs?
- Markets
- Period
- –
- Period length
- 2005 – 2026
- Data
- 1-hour candles built from one-minute data
- Sample
- 39,471 market-days from 7 markets (about 5,640.0 trading days each)
- Source
- OANDA CFD one-minute mid prices · New York trading days
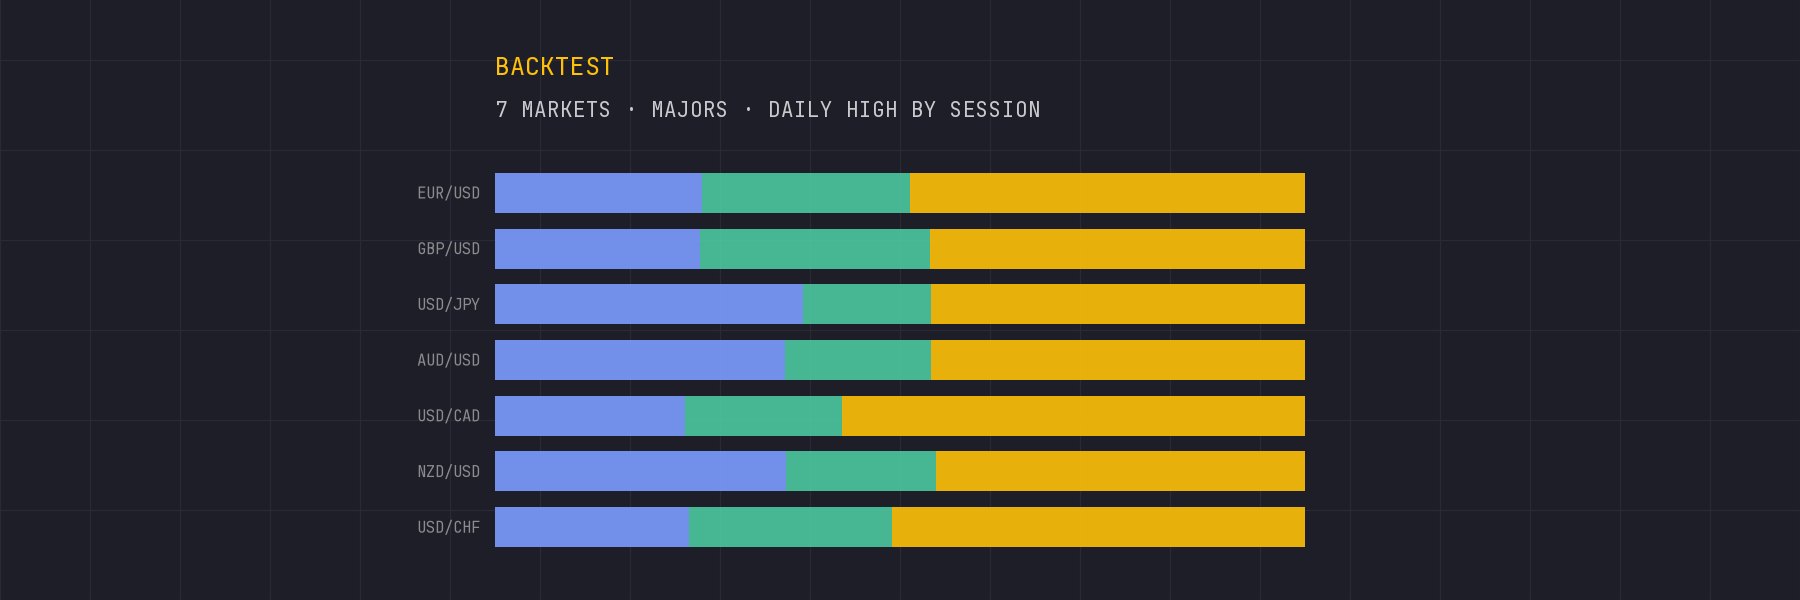
A day's range is its high minus its low. For each session we measured its own range (session high minus session low) as a share of the day's range, and noted which session had the biggest range. 7 markets, 2005 to September 30, 2026: EUR/USD, GBP/USD, USD/JPY, AUD/USD, USD/CAD, NZD/USD and USD/CHF.
Forex session times used here (New York time)
Every trading day runs from 17:00 to 17:00 New York time and is cut into three sessions that do not overlap, so each hour belongs to exactly one of them:
- Asia: 17:00 to 02:00 (9 hours, starting the evening before)
- London: 02:00 to 08:00 (6 hours, before New York opens)
- New York: 08:00 to 17:00 (9 hours, including the London afternoon)
The sessions are not the same length. If time were all that mattered, Asia and New York would each get 37.5% of anything and London 25%. Every result below should be read against those numbers.
One thing to know before reading the numbers: the three shares add up to more than 100%. Sessions often move back over the same prices, so a session can cover 60% of the day's range and the next one 70%.
Majors together
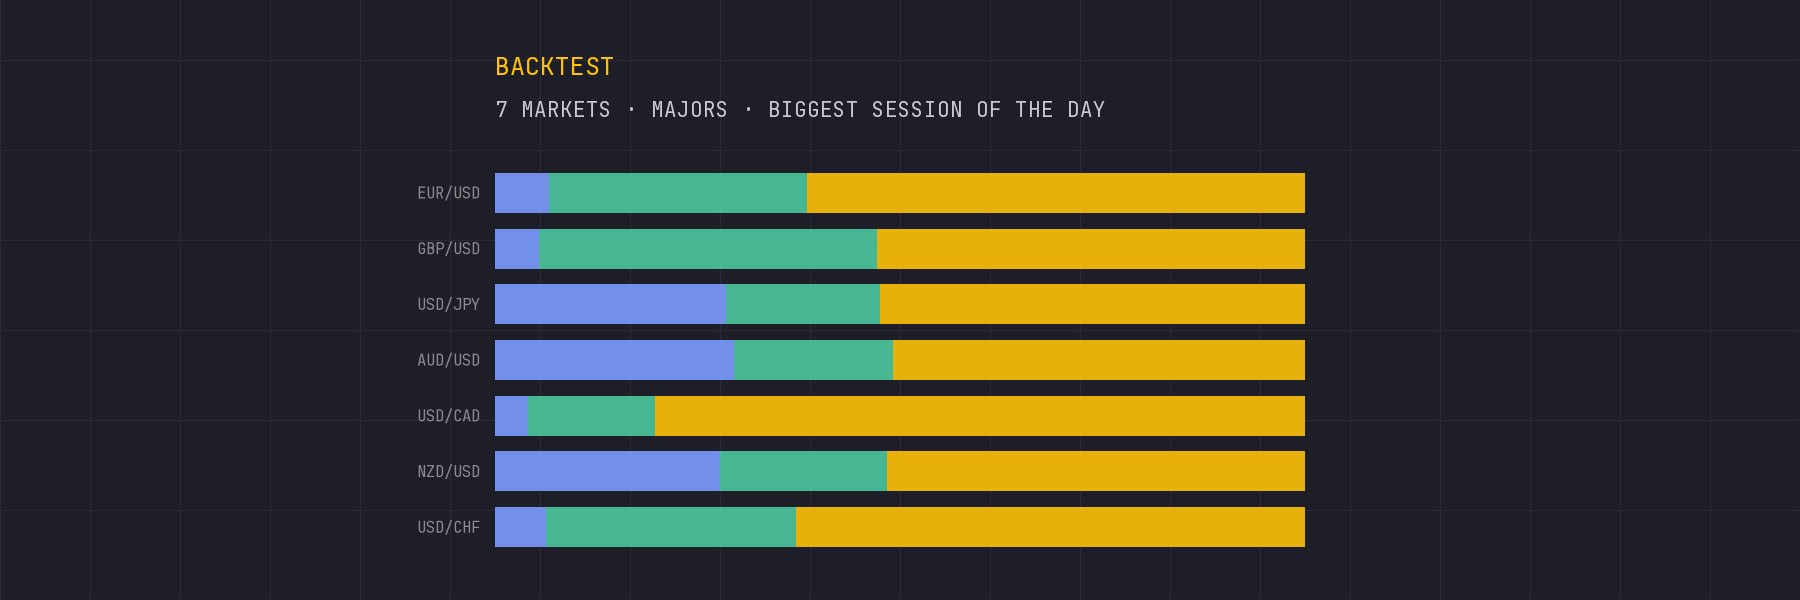
On an average day, New York covered 71.4% of the daily range, London 56.0% and Asia 46.9%. New York had the biggest range on 58.9% of days, London on 25.6% and Asia on 15.5%.
London has only six of the 24 hours, a time share of 25%, and had the biggest range on 25.6% of days.
Market by market
- Asia: share of days with the biggest range: highest at AUD/USD (29.6%), lowest at USD/CAD (4.1%).
- London: share of days with the biggest range: highest at GBP/USD (41.7%), lowest at USD/CAD (15.7%).
- New York: share of days with the biggest range: highest at USD/CAD (80.3%), lowest at AUD/USD (50.9%).
Year by year
The results section below shows each market by year. Over the 21 full years in which all 7 markets traded, the share of days where New York had the biggest range ranged from 51.8% (2007) to 66.3% (2023) for the group.
What this is useful for
It tells you which session usually does the work in these markets. That matters for when to watch, where to expect the bulk of a day's movement, and how much is usually left after a session has run. It says nothing about direction.
Results by market
All years together, one row per market; the last row adds the markets together. Every value is a percentage of the days counted. Pick a market's name to see it year by year.
Majors
7 markets
| Market | Days | Share | Biggest | ||||
|---|---|---|---|---|---|---|---|
| Asia | London | New YorkNY | Asia | London | New YorkNY | ||
| EUR/USD | 5638 | 40.1 | 59.1 | 73.2 | 6.7 | 31.8 | 61.5 |
| GBP/USD | 5639 | 38.5 | 64.3 | 69.8 | 5.5 | 41.7 | 52.8 |
| USD/JPY | 5639 | 55.8 | 51.5 | 68.2 | 28.5 | 19.0 | 52.4 |
| AUD/USD | 5639 | 57.6 | 52.5 | 67.4 | 29.6 | 19.6 | 50.9 |
| USD/CAD | 5639 | 39.2 | 51.9 | 80.2 | 4.1 | 15.7 | 80.3 |
| NZD/USD | 5638 | 56.8 | 52.9 | 67.8 | 27.8 | 20.6 | 51.6 |
| USD/CHF | 5639 | 40.0 | 59.6 | 73.4 | 6.3 | 30.9 | 62.8 |
| All majors | 39471 | 46.9 | 56.0 | 71.4 | 15.5 | 25.6 | 58.9 |
Year by year
EUR/USD: 5638 complete trading days, 2005-01-03 to 2026-09-30.
- Asia
- London
- New York
- Bars, top to bottom: session with the biggest range of the day.
| Year | Days | Share | Biggest | Chart | ||||
|---|---|---|---|---|---|---|---|---|
| Asia | London | New YorkNY | Asia | London | New YorkNY | |||
| 2005 | 260 | 43.5 | 54.3 | 73.1 | 12.7 | 24.6 | 62.7 | |
| 2006 | 259 | 40.1 | 54.5 | 76.9 | 7.3 | 24.7 | 68.0 | |
| 2007 | 258 | 39.8 | 62.0 | 70.5 | 5.4 | 36.4 | 58.1 | |
| 2008 | 260 | 44.2 | 59.4 | 71.1 | 9.6 | 32.7 | 57.7 | |
| 2009 | 259 | 46.0 | 56.5 | 72.7 | 10.8 | 28.2 | 61.0 | |
| 2010 | 260 | 45.6 | 59.4 | 68.8 | 13.1 | 31.2 | 55.8 | |
| 2011 | 260 | 44.1 | 60.7 | 71.9 | 8.8 | 35.8 | 55.4 | |
| 2012 | 259 | 40.3 | 62.1 | 69.5 | 6.9 | 37.1 | 56.0 | |
| 2013 | 259 | 37.7 | 58.8 | 75.1 | 3.9 | 31.7 | 64.5 | |
| 2014 | 259 | 34.5 | 61.9 | 72.4 | 3.5 | 39.4 | 57.1 | |
| 2015 | 259 | 36.9 | 60.6 | 73.9 | 4.2 | 35.5 | 60.2 | |
| 2016 | 259 | 39.3 | 57.1 | 73.8 | 5.8 | 30.1 | 64.1 | |
| 2017 | 258 | 40.0 | 59.4 | 72.5 | 5.8 | 34.5 | 59.7 | |
| 2018 | 259 | 37.5 | 62.4 | 71.3 | 3.9 | 40.5 | 55.6 | |
| 2019 | 259 | 36.3 | 59.1 | 76.8 | 3.9 | 25.9 | 70.3 | |
| 2020 | 260 | 39.4 | 62.2 | 71.8 | 6.5 | 40.0 | 53.5 | |
| 2021 | 260 | 38.3 | 60.7 | 73.8 | 5.0 | 35.0 | 60.0 | |
| 2022 | 259 | 39.9 | 60.9 | 73.4 | 4.6 | 30.9 | 64.5 | |
| 2023 | 259 | 36.0 | 57.2 | 77.3 | 1.9 | 23.2 | 74.9 | |
| 2024 | 260 | 35.5 | 57.1 | 75.6 | 4.2 | 27.3 | 68.5 | |
| 2025 | 259 | 45.1 | 57.9 | 74.2 | 10.4 | 27.4 | 62.2 | |
| 2026* | 194 | 43.7 | 56.2 | 73.7 | 8.8 | 26.3 | 64.9 | |
| All years | 5638 | 40.1 | 59.1 | 73.2 | 6.7 | 31.8 | 61.5 | |
Every value is a percentage of the days counted. * 2026 runs until 2026-09-30.
How this was measured
- Data: OANDA CFD one-minute mid prices (halfway between bid and ask). They are grouped into 1-hour candles in New York time, so US daylight saving time is followed automatically, including the older rules before 2007.
- Trading day: 17:00 to 17:00 New York time, Monday to Friday. Asia 17:00–02:00, London 02:00–08:00, New York 08:00–17:00.
- Which days count: a day needs at least one traded hour in every session and at least 75% of the usual number of trading hours for that market in that year. Holidays and half days drop out this way.
- Which years count: a market's year is used only if it has at least 100 complete days. Years where a market did not trade in all three sessions are therefore left out for that market.
- Ties: when two sessions reach exactly the same price, the earlier session gets it.
- Totals: "together" simply adds up the market-days of the 7 markets. Markets in the same group move together (the crosses share currencies, the US indices move as one), so 39,471 market-days are not 39,471 independent observations.
- Year by year in the text: only full calendar years in which every one of the 7 markets has data are used, so the group is the same in every year. The current, unfinished year is not part of that range (it is in the tables, marked with *).
- Period: 2005 (or the first year with full data for a market) to September 30, 2026.
- Session share: session range divided by day range, averaged over all days with a day range above zero.
- Biggest session: the session with the largest high-minus-low range that day; if two are equal, the earlier one.
Historical statistics for research and education, not trading advice. Past market behaviour does not guarantee future results.